Bar Chart
A bar chart is a graphical illustration of data using rectangular bars, where the length of each bar relates to the value or quantity it represents.
How are Bar Chart used on projects?
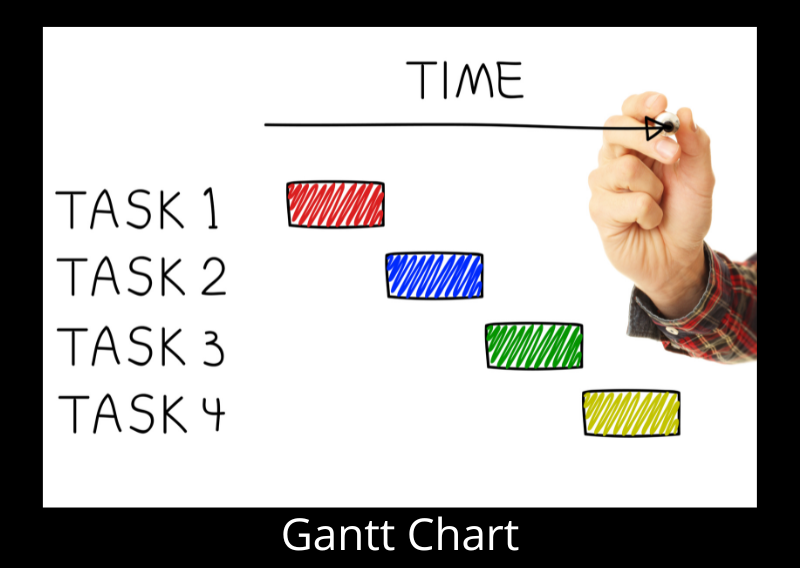
Bar Charts have various used in project management, such as:Gantt Charts
These bar charts represent the project schedule. Gantt charts display the start and end dates of different tasks or activities within a project, with each task shown as a horizontal bar. This visual representation helps project managers and team members understand the timeline, dependencies, and progress.
Resource Allocation
Bar charts can illustrate the allocation of resources, such as staffing, materials, or equipment, over the project duration. For can help identify over- or under-utilization of resources and facilitate adjustments for more efficient resource management. This image is an example of a bar chart known as a Resource Histogram....
Budgeting and Cost Management
Bars can represent budget allocations and actual expenditures across different project phases or cost categories. This allows project managers to monitor budget performance, control costs, and make informed decisions on resource allocation.
Performance Metrics
Project managers can use bar charts to track and communicate various performance metrics, such as the number of completed tasks, milestones achieved, or issues resolved over a specific period.Bar charts are valuable tools in project management, providing a visual representation of data that can aid in planning, monitoring, and controlling various aspects of a project. They help project managers and team members quickly grasp information, identify trends or issues, and make informed decisions.
See also What are Gantt Charts? How they work, history, examples and limitations, What is a Resource Histogram?
See all project management words
Methodology specific dictionaries / glossaries
- View the Agile Dictionary
- Managing Successful Programmes (MSP) Dictionary
- Prince 2 glossary of terms
- Full ITIL glossary of terms
- See also Risk Management Dictionary.

