

What are the benefits of a Data Flow Diagram?
Data Flow Diagrams (DFDs) are powerful tools in system analysis and design, offering numerous benefits by providing a visual representation of how data moves through a system. They help analysts, developers, and stakeholders understand and improve processes by showing:
-
Data sources:
- Clearly identifies where data originates, whether from external entities, users, or other systems
- Helps in understanding input requirements and data dependencies
-
Processing details:
- Illustrates what processing happens and by whom
- Highlights the transformation of data as it moves through the system
- Aids in identifying bottlenecks, redundancies, or inefficiencies in data handling
-
Data usage:
- Shows who uses the data and for what purposes
- Helps in understanding data flow patterns and user interactions with the system
- Facilitates better user experience design and access control planning
-
Data storage:
- Indicates where data is stored and when
- Assists in database design and optimization
- Helps in planning data retention policies and backup strategies
-
Outputs produced:
- Clearly shows the end results and outputs of the system
- Aids in ensuring that the system meets its intended goals and user requirements
Additional benefits of using DFDs include:
-
Communication tool:
- Serves as a common language between technical and non-technical stakeholders
- Facilitates better understanding and agreement on system requirements
-
System boundary definition:
- Helps in clearly delineating the scope of the system
- Identifies external entities and their interactions with the system
-
Hierarchical representation:
- Allows for different levels of abstraction (Level 0, 1, 2, etc.)
- Enables both high-level overview and detailed process analysis
-
Gap analysis:
- Helps in identifying missing processes, data stores, or flows in the current system
- Facilitates comparison between current and proposed systems
-
Documentation:
- Provides a clear, visual documentation of the system
- Serves as a reference for future maintenance and upgrades
-
Security analysis:
- Helps in identifying potential security vulnerabilities in data flow
- Aids in implementing proper data protection measures
-
Compliance:
- Assists in ensuring that data handling processes comply with relevant regulations and standards
-
Process optimization:
- Facilitates the identification of redundant processes or unnecessary data flows
- Helps in streamlining and optimizing system operations
By providing these insights, Data Flow Diagrams significantly contribute to better system design, more efficient processes, improved communication among team members, and ultimately, the development of more effective and user-friendly systems.
What do DFDs look like?
In DFDs, data flows are represented by arrows, while processes are represented by circles, rectangles, or other shapes. External entities that interact with the system are shown as boxes, and data storage points are typically depicted as two parallel lines, like an open-ended rectangle.The different levels of Data Flow Diagram
Representing the complete business system often requires multiple levels of diagram.Context Diagram (Level 0 DFD)
This is the highest level of a DFD and provides a very abstract, high-level view of the system. The entire system is represented as a single process, with arrows indicating the data flow into and out of the system from external entities. It serves as a broad overview of the system and its interaction with external factors. This diagram is particularly useful for providing stakeholders with a rudimentary understanding of the system.Level 1 DFD
This diagram breaks down the system from the Context Diagram into its major, high-level process components. Each component is represented as a process in this DFD. Level 1 DFD shows how the system is divided into sub-systems (processes), illustrating the flow of information from and to each of these sub-systems and how they interact with each other. As per the convention, it should typically describe the system using between two and seven functions.[Level 1 Data Flow Diagram -] this highlights the main functions carried out by the system. As a rule, we try to describe the system using between two and seven functions. SQA
Characteristics of level 1 DFD
- Level of detail: They provide an overview of the main components and processes in a system, without diving into the minute details of each process.
- Scope: They show the entire system at a high level, including external entities (like the User), major processes, and data stores.
- Abstraction: They abstract complex processes into single nodes. For example, in the Blockchain example below "Solve PoW" (Proof of Work) is represented as a single step, though in reality it involves complex computations.
- System boundaries: They clearly show the boundaries of the system, including interactions with external entities (the User).
- Major data flows: They illustrate the main data flows between processes, without breaking them down into more granular sub-processes.
Level 2 DFD
If necessary, each of the high-level processes of the Level 1 DFD can be further broken down into their lower-level processes in the Level 2 DFD. This allows for a more detailed representation and understanding of the system's functioning. Each of these processes can be further divided into even lower levels until sufficient detail is achieved.Level n DFD
Theoretically, this decomposition can continue for several levels. Each level adds more details and complexity to the system's description.Example Data Flow Diagram
This example of a level 1 data flow diagrams is free to copy, download and use.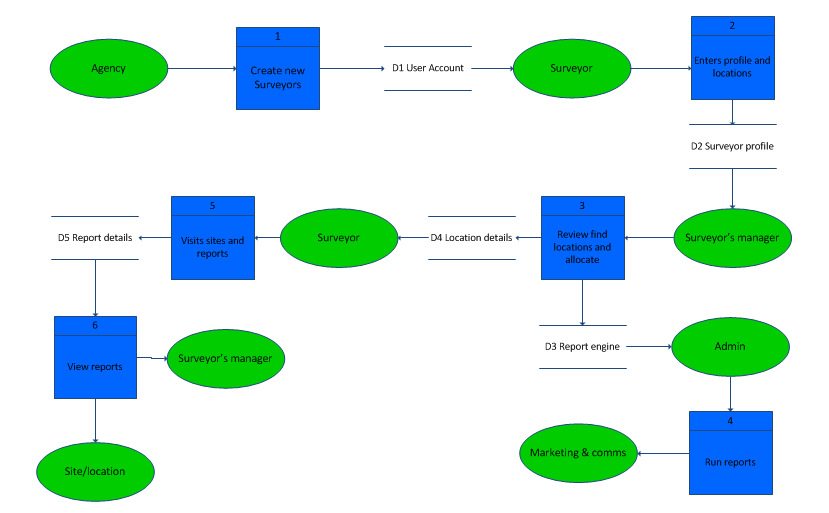
Download Data Flow Diagram in Visio format
Download Data Flow Diagram in pdf format
Other example data flow diagrams

https://commons.wikimedia.org/wiki/File%3ADFD1.png

https://commons.wikimedia.org/wiki/File%3ALevel1.gif
Data Flow Diagram - references
https://whatsupnew.com/wp-content/uploads/image3.gifSQA https://www.sqa.org.uk/e-learning/SDM03CD/page_12.htm