

Data flow diagrams or DFDs help the analysis of systems by showing:
- Data sources
- What processing happens and by whom
- Who uses the data
- Where data is stored and when
- Outputs produced
The different levels of Data Flow Diagram
Representing the complete business system often requires multiple levels of diagram.Context Diagram (Level 0 DFD)
This is the highest level of a DFD and provides a very abstract, high-level view of the system. The entire system is represented as a single process, with arrows indicating the data flow into and out of the system from external entities. It serves as a broad overview of the system and its interaction with external factors. This diagram is particularly useful for providing stakeholders with a rudimentary understanding of the system.Level 1 DFD
This diagram breaks down the system from the Context Diagram into its major, high-level process components. Each component is represented as a process in this DFD. Level 1 DFD shows how the system is divided into sub-systems (processes), illustrating the flow of information from and to each of these sub-systems and how they interact with each other. As per the convention, it should typically describe the system using between two and seven functions.[Level 1 Data Flow Diagram -] this highlights the main functions carried out by the system. As a rule, we try to describe the system using between two and seven functions. SQA
Level 2 DFD
If necessary, each of the high-level processes of the Level 1 DFD can be further broken down into their lower-level processes in the Level 2 DFD. This allows for a more detailed representation and understanding of the system's functioning. Each of these processes can be further divided into even lower levels until sufficient detail is achieved.Level n DFD
Theoretically, this decomposition can continue for several levels. Each level adds more details and complexity to the system's description.Example Data Flow Diagram
This example of a level 1 data flow diagrams is free to copy, download and use.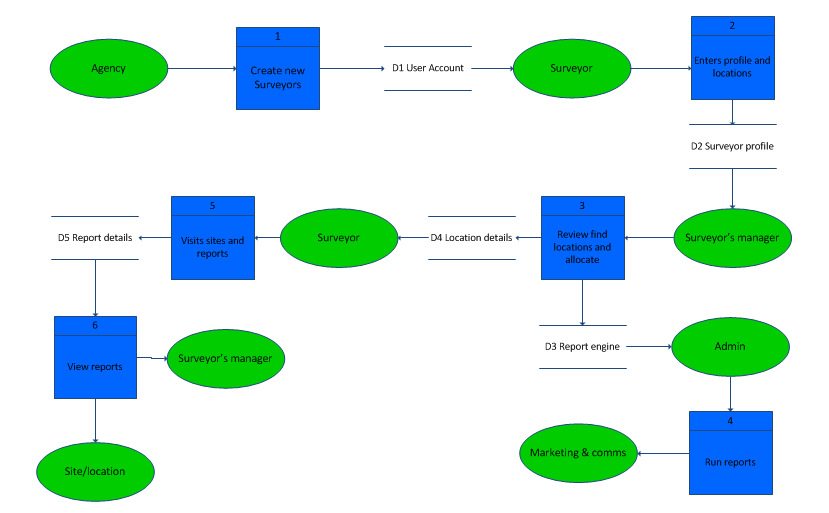
Download Data Flow Diagram in Visio format
Download Data Flow Diagram in pdf format
Other example data flow diagrams

https://commons.wikimedia.org/wiki/File%3ADFD1.png

https://commons.wikimedia.org/wiki/File%3ALevel1.gif
Data Flow Diagram - references
https://whatsupnew.com/wp-content/uploads/image3.gifSQA https://www.sqa.org.uk/e-learning/SDM03CD/page_12.htm